Gathering Support Diagnostic Files
This article explains how to collect Datto Endpoint Backup application diagnostic log files for Datto Technical Support analysis.
NOTE The steps in this article are specific to the products listed in the Environment field below. For other Datto Unified Backup products, see the Additional Resources.
Environment 
- Datto Endpoint Backup
Description
 Logs to collect for installation issues

If your issue is related to a failed install or un-install of the Datto Endpoint Backup agent, follow the steps below to collect needed logs.
Log into your protected production machine, and navigate to %systemdrive%\Users\<USER>\AppData\Local\Temp.
Select the log files that are in the format of Datto_Endpoint_Backup_xxx.log.
.png)
There is also a log file in this same folder, named Datto_Endpoint_Backup_xxx_DattoEssentialsx64.msi. This file should also be included.
Add the selected files to a ZIP, TAR, or 7z archive.
Navigate to %windir%\inf\.
Select the setupapi.dev.log.
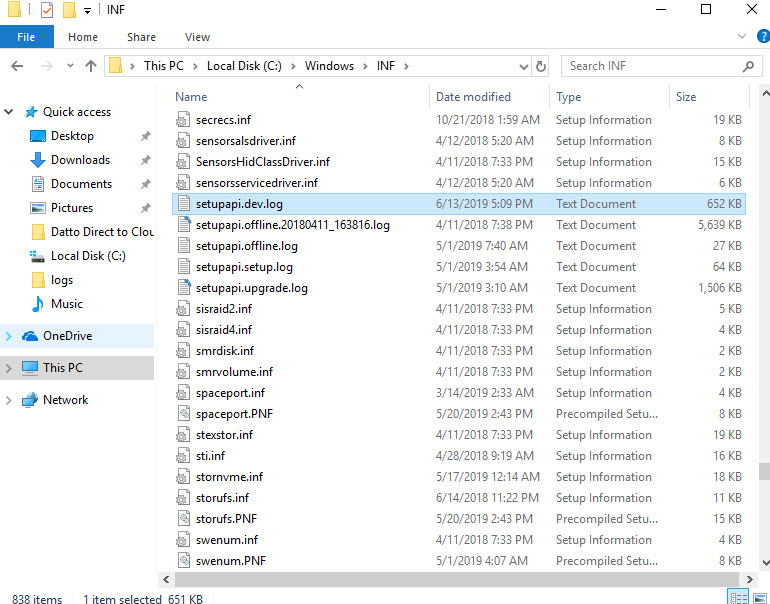
Add the selected file to your ZIP, TAR, or 7z archive.
Attach the archive you created to your Support case.
Logs to collect for non-installation issues
If your issue is not related to an install or un-install of Datto Endpoint Backup agent, follow the steps below to collect needed logs.
Log into your protected production machine, and navigate to %windir%\System32\config\systemprofile\AppData\Local\Datto\Datto Cloud Continuity\.
IMPORTANT Due to Windows User Account Control (UAC) restrictions, you may be unable to navigate directly to the specified directory via Windows Explorer. If you find this to be the case on your production machine, you will need to navigate to the logs folder directory-by-directory, authorizing any UAC popups you receive during navigation.
Select the log folders and add them to a ZIP, TAR, or 7z archive.
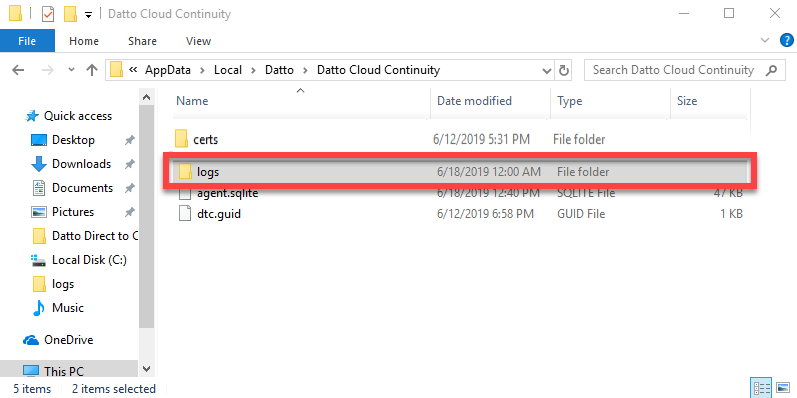
Attach the archive you created to your Support case.
Windows System and Application logs The Windows System and Application logs can be useful in troubleshooting issues whether or not the problem is install related. Datto Technical Support may also request these logs for troubleshooting purposes.
To collect Windows logs, perform the following steps for both the Application and System logs. The example screen captures are from a Windows 10 machine.
On the protected machine:
Right-click on the Windows icon in the lower corner of your screen and choose Event Viewer from the pop-up menu.
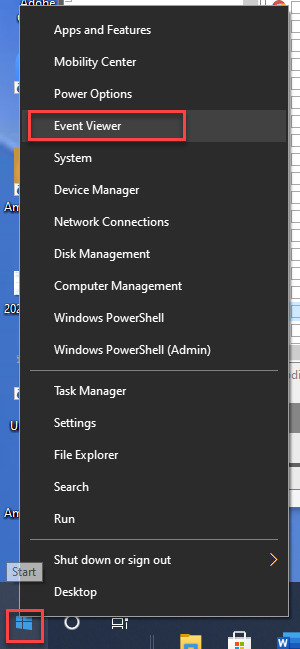
On the left pane, navigate to the Windows logs drop-down menu and click the name of the log you wish to open.
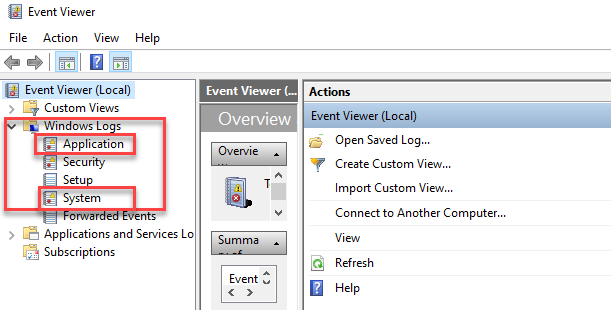
In the Action menu, click Save All Events As.
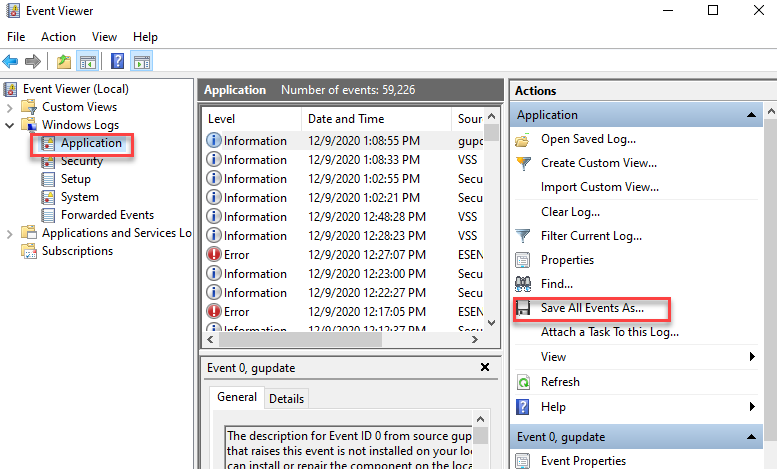
Navigate to where you wish to save your log file.
In File name, enter a name for the archived log file.
In Save as type, select a file format, and then click Save. Datto recommends exporting logs in EVTX format.
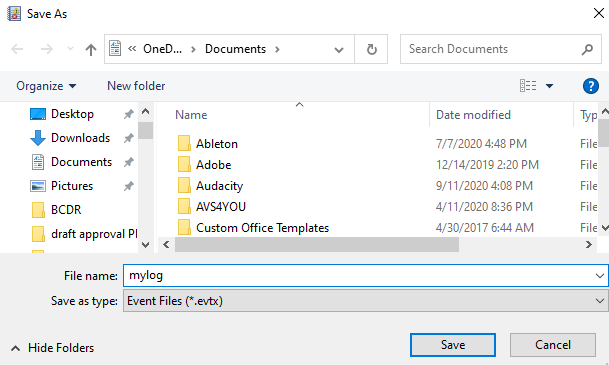
Click Save.
Add the logs to a ZIP, TAR, or 7z archive.
Attach the exported logs to your support ticket.
Gathering a memory dumpIn rare cases where a protected system is shutting down unexpectedly or blue screening, you may be asked to gather a memory dump for more information in addition to the other diagnostic logs. For full information on gathering and reading these dump files refer to: How to read the small memory dump file that is created by Windows if a crash occurs.
To configure startup and recovery options to use the small memory dump file, follow these steps.
NOTE The following steps may be different on your computer depending on your version of Windows. If they differ, see your product documentation to complete these steps.
Select Start > Control Panel.
Double-click System, and then select Advanced system settings > Advanced.
Under Startup and Recovery, select Settings.
In the Write debugging information list, select Small memory dump (256k).
To change the folder location for the small memory dump files, type a new path in the Dump File box or in the Small dump directory box (depending on your version of Windows).


